Much work has been done on social
networks and interactions, and how they relate to diffusion in a society. This
diffusion can be of ideas, technology, disease or anything else that can be
transmitted from one person to another. Given the recent Covid-19 outbreak, it
might be useful to look at some basics to see if it can provide some insight
into the dynamics of contagion and possible mitigation steps.
For the purpose of this post I’ll
be using the example of a viral infection.
Diffusion and Contagion
The most fundamental model of
contagion in a society is the SIR model. The acronym stands for the three
states a person in a population can be in with regards to a contagion:
- Susceptible – hasn’t gotten the virus yet, but could get it from another person
- Infected – has the virus and can potentially infect someone else
- Removed/Recovered – had the virus, but is no longer a threat, either through recovering and developing and immunity, or through dying.
Another version of this model is
the SIS model, in which a person returns to being susceptible after having been
infected.
The basic idea behind this model
is that people randomly come into contact with each other and there is a
possibility of contagion if an infected person meets a susceptible person.
There is no transmission if people coming into contact with each other are
either both susceptible or both infected (or both removed).
Given this setup, the graph of
total number of people infected over time look something like this. This is a
cumulative figure which includes everyone ever infected. The underlying graph
of new cases per time looks like this and serves as a rough indicator of how
many people are infected at a particular point in time.

 We see that in the first half,
the number of cases start slow, but grow at an increasing rate. This is
because, initially, there are very few people who can infect others. Therefore,
random meetings do not have a high probability of causing the transmission of
the virus and the number of new cases doesn’t grow very rapidly. However, any
interaction by an infected person is likely to lead to a new case, because
infected people are mostly coming into contact with susceptible people. Over
time, the number of infected people grows and the rate of new cases also
increases. At the halfway mark, the rate of new cases coming in is at its peak
– half the population is infected, and there is a fifty percent chance that any
interaction an individual has is with an infected person.
We see that in the first half,
the number of cases start slow, but grow at an increasing rate. This is
because, initially, there are very few people who can infect others. Therefore,
random meetings do not have a high probability of causing the transmission of
the virus and the number of new cases doesn’t grow very rapidly. However, any
interaction by an infected person is likely to lead to a new case, because
infected people are mostly coming into contact with susceptible people. Over
time, the number of infected people grows and the rate of new cases also
increases. At the halfway mark, the rate of new cases coming in is at its peak
– half the population is infected, and there is a fifty percent chance that any
interaction an individual has is with an infected person.
After reaching the halfway mark
the infection slows down. This means that the number of new cases is starting
to shrink. This is simply because now most of the population is already
infected. Thus, random interactions are more likely to be between people who
are already infected and not lead to new cases. Simply put, there are fewer
susceptible people around to infect leading to fewer new cases of infection.
This S-curve looks somewhat like
what we’ve seen from China (though of course there are differences in the
mechanism as they quarantined effectively). Most other countries are at
different stages in the first half of the curve. Obviously, the total number of
people infected in the end can be reduced if we limit the number of people
coming into contact with each other. In those cases, the infection will start
to slow down earlier as, again, there are fewer people left to infect.
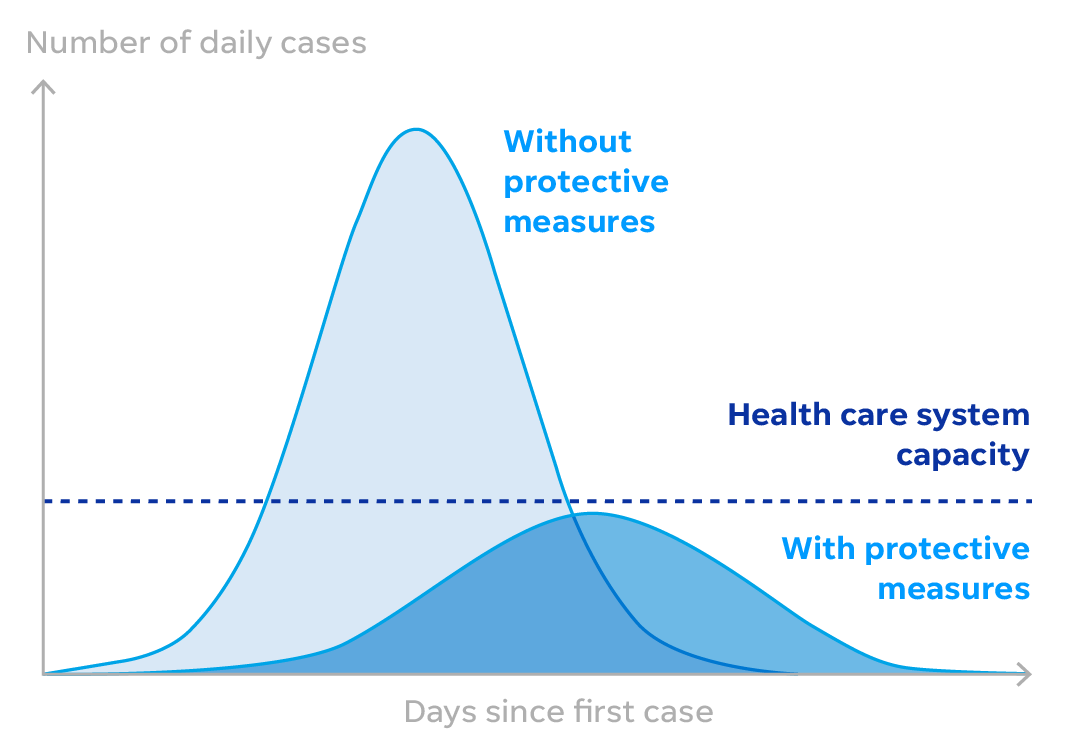
By exercising distancing,
countries are trying to reduce the number of interactions between people, and
consequently slow the number of new cases of infection. The intention of
‘flattening the curve’ does not seem to be to prevent everyone from getting the
virus at all. Certainly, for vulnerable groups, such as the aged and those with
compromised immune systems, the hope is that they will not catch the virus at
all.
For everyone else, however, the
intention is more to prevent hospitals from being flooded by cases all at once.
Thus, the hope is that anyone infected gets the best possible care and improves
their chances of recovery. I think it is implicitly understood that most people
will probably get infected and the hope is that they will develop an immunity
to it. The UK took a novel (and extreme) position on this called ‘herd
immunity’ where they decided to let a large number of people get infected, so
that they develop an immunity and are no longer contributing to the spread of
infection. In terms of the SIS model, this means that people move to the
Recovered/Removed category. They have now abandoned this idea as being too
risky (among other things, it was pointed out that we don’t know yet whether
Covid-19 follows a SIR type model or an SIS one).

Detection
Now that we have some basic
understanding of the dynamics of contagion, we can more towards questions of
detection, which is in itself an interesting problem.
Another way to think about
contagion is through the spread of a virus along a network. People are
connected to each other through real-life social networks. They are likely to
interact with people they have some relationship with and thus the system of
infection operated within these networks. The size of each component in a
network could give some idea as to how much the virus will spread. So, an
individual can get infected through contact with someone in their family and
then pass it along to people at work who then pass it along to their friends
and family and so on. Everyone in this chain of events is in the same component
of a network. Thus, the chances of spread are high when people are highly interconnected.
Here again, we can see that the concept of distancing is an attempt at severing
the links and break the network into smaller components to block the paths of
contagion.
By thinking in terms of networks,
we also come to another realisation. People who are very well connected, or at
the heart of a network, are much more susceptible to infection than people on
the peripheries. If I have only one social connection, and that connection is
in turn only connected to me, there is practically zero chance of either of us
catching viral infection. On the other hand, if I have a lot of connections, or
am connected to people who have a large number of connections, they I am much
more susceptible to infection because it would just take one of those many
people to get infected for me to be exposed to it.
Christakis and Fowler decided to
use this principle to develop an early detection system for outbreaks. Their
idea was that people who are more central in a network (i.e. they are well
connected, directly or indirectly) are more likely to catch a contagious
disease earlier than people selected at random. They tested this theory in a
study and found that it did indeed hold. Students who had more friends or were
more central to a network went through the flu cycle several days before a
randomly selected group of students did. Thus, their idea was that one could
monitor people who were more central in a network and use them as markers for
an early warning system for the general population.
Perhaps governments such as
Pakistan that have limited capacity to carry out large scale testing should be
looking towards targeting their testing. It seems they already are targeting in
that they are checking travellers and people with symptoms. But maybe they
should also be looking at other factors as well – such as centrality of
individuals. How this centrality is established is a tricky question that will
have to be figured out.
The approach taken by Christakis
and Fowler was very interesting in that it used the concept of the Friends
Paradox. The idea was basically that if you choose people are random and asked
them to list their friends, the names of people who are more connected are more
likely to turn up. This is because if person A has 1 friend, and person B has
99 friends. When you choose an individual at random, you are more likely to
pick someone who is friends with person B than with person A. So, this is
exactly what they did, they tracked people chosen at random, and compared the
progress of their flu against people who had been named as friends.
This might not be a practical
approach for a government to take (or maybe it is – ask people in a community
to nominate a person to be tested?), but it might be useful to think about how
they could achieve the same goal. So, one might imagine that people in
professions that bring them into contact with a large and diverse group of
people would be prioritised.
I am assuming that these are the
kinds of questions experts in the government are tinkering with now.
Interpreting Detection
Finally, I move to the question
that I feel is critical and needs to be investigated in the current situation.
Given that we have very few tests compared to the size of the population, how
do we interpret them in terms of establishing:
- The current penetration of the infection in the population
- The direction/stage that the infection is currently in.
Standard practice for estimation
in static problems is to draw a random sample of a population and do
calculations on the sample. For example, if one wanted to find out how many
people in a community possess a mobile phone, one would randomly select a sample
of individuals and calculate the proportion with a mobile phone. Given that
these individuals are selected at random, there’s no reason for me to be
systematically over- or under-estimating the average of the community. The
larger the sample, the more confident one would be about the estimate being an
accurate representation of the entire community as it reduces the chances that
the sample I drew was freakishly different from the community as a whole.
That estimate provides me with a
snapshot that gives me an estimate of mobile phone owners in a community at
that point in time. Over time, more people may buy mobile phones, and the
validity of my result will depend on how rapidly that happens.
In the case of testing for a
viral infection however, we are faced with multiple deviations from this simple
setup. Firstly, the testing is not done at random. Generally, we seem to be
testing people who are assumed to be more likely to be infected (or people who
are self-selecting). If the assumption is true, then the number of positive
cases as a percentage of people tested would be much larger than the proportion
of cases in the general population. If the assumption is false, we may end up
thinking the estimates are over-stated when they are not!
However, reporting of cases is
done in terms of total numbers rather than as percentages. Due to asymptomatic
cases, this can never be an overestimate and is most likely an underestimate.
How does one establish confidence levels in this setup?
A huge systemic issue arises from
the complex dynamics of such a problem. It seems to me that the fact that a
person with Covid-19 can take a long time to exhibit symptoms (if at all),
along with the uncertainty on transmission rates and recovery rates, added to
the exponential nature of growth in infection numbers means that daily updates
are very difficult to interpret. Getting any assumption on these figures even
slightly wrong can completely change how we interpret the results from our
tests.
One infected person today who
isn’t tested, could turn into three next, and nine the next, all before the
first person exhibits any symptoms. On the other hand, if everyone gets tested
at the same time today, the snapshot we get of the situation could be outdated
before the results are even available.
This is an issue that has been
bothering me but doesn’t seem to be coming under much discussion – we’re
getting numbers, but what do they mean? One hopes that the government has some
structure in mind in terms of how they establish the system for testing that
provides them with genuine insight into the state of the virus in the country
rather than haphazardly generating numbers that are difficult to interpret and
act upon.
Finally, a major problem with
systems such as this that they exist around tipping points. A millimetre in the
wrong direction and the outcome of the system changes completely. So, for
example, if one were to carry out a vaccination drive that requires 98%
inoculation to be effective, getting 97.5% does not mean that the job is almost
completely done. It means the opposite – 97.5 inoculation is closer to zero
than to 98. This is probably why governments around the world are more
realistically talking about flattening the curve rather than obliterating it.
However,
the government response in such a case will require them to do some serious
mathematic and data collection activities. It will also require them to achieve
and exceed targets. One hopes they are up to the task!
No comments:
Post a Comment